InfoQ 中文 · 10/16/2026, 17:09:04
Retailer Cuts LLM Hallucination to 1.5% via Platform Engineering
A major retailer reduced LLM hallucination rates from 15% to 1.5% by shifting model capabilities from application logic to a unified platform infrastructure. The solution relies on architectural layering and open-source transparent components rather than stronger base models, offering a reproducible engineering codebase for local execution.
SOURCE COVERAGEFull Original Report
Contents14 sections
Core Content: A major retail enterprise reduced the hallucination rate of its LLM-based inventory recommendation system from 15% to 1.5%. The key was treating large model capabilities as platform-level infrastructure rather than application-layer business logic. This platform unifies governance for models like Gemini and GPT, supporting dozens of business scenarios.
Key Insights: The drop in hallucination rates is primarily due to architectural layering—platformizing large model capabilities instead of embedding them in applications. The platform covers SKU-level anomaly analysis and inventory correction suggestion generation. All components are open-source with no hidden abstractions, emphasizing understandability and engineering transparency.
Target Audience: Platform Engineers, MLOps Engineers, Enterprise AI System Architects

In the first month after we deployed our LLM-based inventory recommendation system to production, approximately 15% of agent responses were hallucinations—sounding plausible but lacking any factual basis.
Six months later, the hallucination rate dropped to 1.5%. The key driver behind this improvement was not switching to a more powerful foundation model, but a strategic decision: stop treating large model capabilities as an application-layer business problem and start treating them as platform infrastructure.
The project described in this article is an inventory accuracy platform for a major retail enterprise. System inventory records often deviate from actual shelf stock due to misplacement, damage, theft, and counting errors. These discrepancies impact ordering, replenishment, and product availability.
Our multi-agent LLM system analyzes anomaly signals across millions of SKUs and billions of historical inventory records, generating inventory correction recommendations for business teams to maintain accurate inventory data.
The platform layer described here was built collaboratively by business stakeholders, product managers, software engineers, data scientists, and data engineering experts. It currently serves dozens of application teams, covering scenarios such as inventory audits, replenishment reviews, and discrepancy triage.
This article documents this architectural shift—unified routing and governance of foundation models like Gemini and GPT for enterprise-scale traffic. The engineering paradigms discussed below are exactly what I wish we had on day one of the project launch.
All foundational components mentioned in this article are implemented in the accompanying GitHub repository. The code is deliberately designed without hidden abstraction layers. While many frameworks use decorators or built-in agents to encapsulate underlying logic, this repository exposes all internal mechanics to ensure these engineering paradigms are clear and understandable.
Code snippets in this article are taken directly from that repository. There is one intentional difference between the repository and the production environment: the repository runs local models (llama3.1) via Ollama using LiteLLM for integration, rather than calling cloud-hosted foundation models. The entire solution can run end-to-end locally without any API costs.
Why Standalone LLM Applications Fail at Scale
Almost every team encounters highly similar failure modes, which can even be predicted: prototypes work, initial production deployments look fine for the first week. Then, issues that didn't surface during evaluation begin appearing on monitoring dashboards.
In our case, three types of problems emerged during testing, each representing scenarios not covered by the prototype phase. First was LLM API rate limiting. Under real request volumes, we started getting throttled by model providers. Second was context issues. When the system recommended inappropriate products, the root cause was almost always the input data provided to the model, not the model itself—indicating that robust data engineering pipelines are core to solving these problems. Third was the big issue: hallucinations. Rare in isolation, but consistently present under sustained production traffic. We designed monitoring capabilities within the platform to track these failures; this visibility turned each problem from a mystery into a fixable object.
After tracking these issues, it became clear that they should be handled centrally at the platform layer, not left to individual applications. Three characteristics stood out:
- Hallucinations are output problems, not program bugs. Hallucinated content does not throw stack trace exceptions; all traditional health checks pass. Downstream services receive the results and act on them, only discovering much later that the facts backing the recommendation never existed.
- Uncontrolled token consumption. Without per-request attribution of usage, monthly bills show only a single total amount from the provider. It's impossible to distinguish which application, team, or scenario generated the cost, leaving optimization to guesswork.
- Unobservable behavior. Latency dashboards show normal P99 latency, and error rates are near zero. However, model output quality silently degrades while remaining syntactically valid.
None of these are application bugs. Almost every team building LLM features encounters similar issues, and the immediate reaction is usually to fix them within the application. This leads to N teams writing N copies of duplicate scaffolding code. This common functionality should have been pushed down to the platform layer for unified implementation.
Reasons for Building a Shared Large Model Platform
Centralizing large model capabilities is not just theoretical. It follows the same logic as centralizing authentication, logging, and service meshes in large systems: when multiple applications share the same cross-module generic needs, the cost of redundant development exceeds the cost of building shared infrastructure.
For LLMs, the shared concerns are:
- Retry logic and failure classification
- Prompt registry and version management
- Schema enforcement
- Per-request token cost tracking
- Behavioral observability
- Tool invocation and context routing
- Authentication and authorization across tool services
There is a second-order effect that matters more than duplication. A shared platform enforces contracts: applications declare what they need (i.e., models, prompt versions, schemas, toolsets, evaluation engines), and the platform delivers. It is precisely these contracts that allow new applications to go live in days, because the hardest parts have already been solved by the platform.
The decision point for building this platform is not when the first LLM application goes live, but when the second one does. Waiting until ten teams have each independently launched large model features before retrofitting a platform underneath will result in a long and difficult migration.
Platform Architecture
Figure 1 illustrates how the foundational components compose together. The codebase implements the complete request path, consistent with the production architecture.
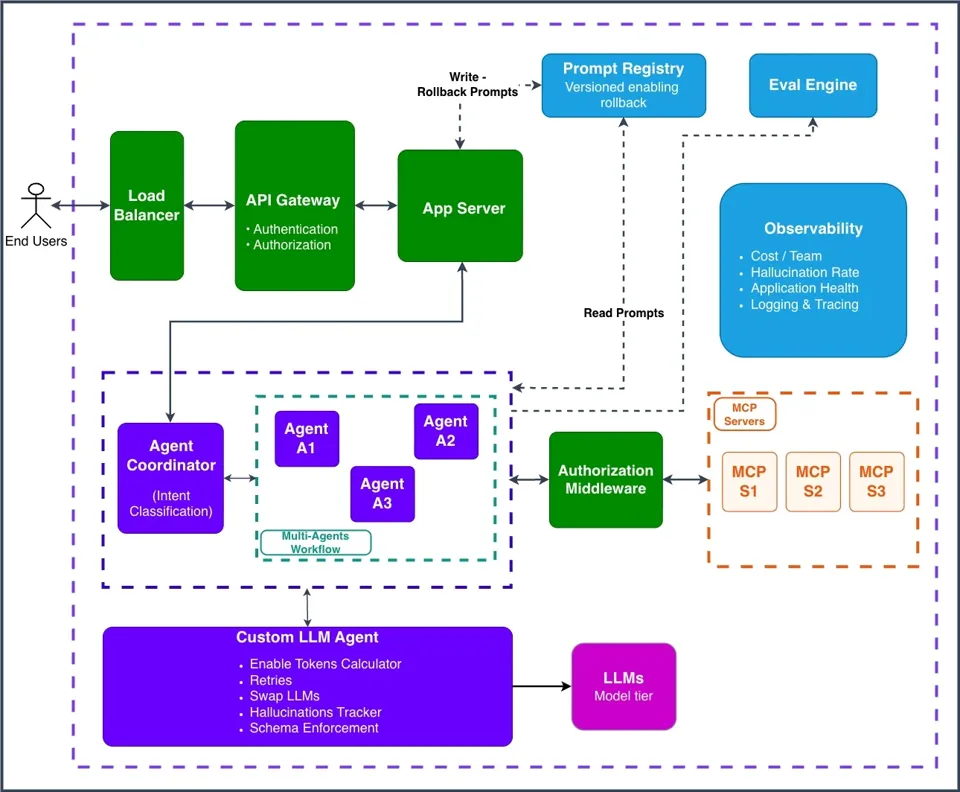
The gateway is the sole entry point. It handles caller authentication, issues JWTs containing role information, exposes agent execution interfaces, provides user/team-level metrics, and offers a prompt rollback interface available only to administrators. Behind the gateway, a root coordinator agent built on Google's Agent Development Kit ADK identifies intent during each request round and dispatches tasks to one or more expert agents; each expert agent binds to prompts and structured output schemas specified in the registry. Expert agents handle tool connectivity, corresponding to multiple independent MCP services isolated by team or scenario; each server validates the caller's token and enforces authorization policies before executing tools.
Orchestration capabilities are implemented via ADK: it provides the topology of agents and sub-agents, delegation calls from the coordinator to expert agents, and callback hooks where the platform logs invocation costs and latency.
All agents invoke models through LiteLLM, allowing seamless switching between model vendors. During local debugging, agents can call local models; in production, they can switch to cloud foundation models like Gemini or GPT simply by changing the model identifier.
Local models in the accompanying codebase are provided by Ollama, enabling the gateway, agents, and tool services to run end-to-end on a laptop without API call costs.
Tool services are deployed based on the Model Context Protocol. ADK's MCP client connects agents to team-side services, which are built using FastMCP.
The value of this layered decoupling lies in ensuring no single framework monopolizes the entire system. The model layer, tool layer, and orchestration layer each rely on stable interfaces; any layer can be replaced—such as swapping in a stronger model, different tool services, or even the orchestration engine—without rewriting the platform's foundational components. This embodies the "no hidden abstractions" principle at the dependency level: each tool does one thing well, and the call paths between components are clearly visible.
Structured Output: Enforce Schema Validation at the Platform Layer and Retry on Failure
The highest ROI change we made was enforcing structured output at the platform boundary rather than the application boundary.
The logic behind this pattern is not novel. Each time an LLM is called, the target schema is declared (we use Pydantic models), and the platform returns results to the caller only after validation passes. If validation fails, the platform appends the validation errors as context to the prompt and resends it to the model, with a configurable retry limit.
Placing this pattern at the platform layer instead of within individual applications brings the following changes:
- A single implementation handles all schema mismatch issues; optimizing once benefits all applications.
- Downstream callers can rely on this contract: if a call succeeds and returns, the output structure is guaranteed to conform to the specification.
- Schema violations become platform monitoring metrics, rather than runtime exceptions buried deep in application logs.
Our output schemas are not just about formatting; they include explicit fields designed to track and isolate hallucinations. Figure 2 shows the DocOutput schema used by the documentation retrieval agent.
from pydantic import BaseModel, Field

class DocOutput(BaseModel):
    """Structured response from the document retrieval agent."""

    answer: str = Field(
        description="The synthesized answer to the user's question."
    )
    sources: list[str] = Field(
        default_factory=list,
        description="List of source document IDs used to generate the answer."
    )
    confidence: float = Field(
        ge=0.0, le=1.0,
        description="Confidence score of the generated answer."
    )
    needs_clarification: bool = Field(
        default=False,
        description="Flag indicating if the query was ambiguous and requires clarification."
    )
This approach ensures that every response from the documentation agent is machine-parseable and traceable back to its sources, significantly improving reliability and debuggability.
Figure 3 shows a sample result returned by the model after satisfying this Schema. The answer field contains the response content, and sources lists the document sources cited in the answer. The grounded flag is set to true if and only if these sources were retrieved and used. If the question falls outside the scope of the documents, the same structure is returned, but grounded is set to false and sources is empty. The platform marks this result as a hallucination signal rather than directly passing through this seemingly confident answer.
{ "answer": "FastAPI's APIRouter lets you group related path operations and mount them on the main app with app.include_router().", "library_name": "FastAPI", "version": "0.115", "sources": [ { "library_id": "/tiangolo/fastapi", "topic": "routing" } ], "grounded": true, "out_of_scope": false}Copy code
Figure 3. Example DocsOutput Response
Generating the grounded and out_of_scope flags incurs zero cost, but it forces the model to commit in a machine-readable format to whether its answer is supported by retrieved context. Validation failures, structural errors, missing fields, and unparseable outputs are the highest-precision signals for the platform to identify hallucinations.
The meaningfulness of the grounded flag depends on what happens before the model generates the response. All expert agents connect to the platform’s MCP server, and the model can only use information returned by tools as factual basis. The root agent’s instructions explicitly state: tool return results are the sole trusted source for answers.
The documentation agent is the best example. Its prompt includes two sequential documentation tools: one queries the ID based on the library name, and the other retrieves the latest official documentation based on the library and topic. Tool usage rules are strict: the agent must retrieve documentation before answering any questions about APIs or parameters, and cannot rely on potentially outdated training data. All conclusions, code examples, and parameter names must come from the retrieved documentation. If the documentation does not cover the question, the agent must honestly state so and cannot guess.
The Schema then requires the model to show its reasoning process. The sources field records each retrieval, and grounded is set to true only when all conclusions derive from tool-returned content. This pattern applies to all expert agents. When an execution agent reports deployment information, its assertions come from MCP tool responses, not model memory. This anchoring is not a prompt-level trick but a complete pipeline: tools fetch evidence, prompts constrain the model to answer based solely on evidence, the Schema forces the model to make declarations, and validation mechanisms convert invalid declarations into statistically trackable, retryable failure tasks.
Strict output Schema validation transforms vague AI failures into clear, structured data events. A single Pydantic model provides all the signals needed for retries, metrics tracking, and evaluation.
Retry Orchestration with Validation
This layer is key to reducing the hallucination rate from 15% to 1.5%, warranting a more detailed discussion.
Blindly retrying failed LLM calls can be harmful. Simply re-running the prompt that produced a hallucination will likely yield another hallucination. Crude retries during outages can trigger traffic storms, overwhelming infrastructure.
The pattern that works for us is:
Failure Classification
Is it a Schema violation, a hallucination signal (low confidence, lack of factual grounding, or generation deviating from intent), or an infrastructure error (timeout, rate limiting, or model unavailability)? These three categories require different handling approaches; lumping them together into generic retry logic is a mistake.
Routing by Category
- Schema Validation Failures: Append the error message to the prompt so the model clearly sees where it went wrong (e.g.,
groundedreturning the string"yes"instead of a boolean, or missing the requiredsourcesfield). - Hallucination Signals: Retry with stronger anchored context (e.g., if the documentation agent returns
grounded: false, or cites non-existent library documentation sources). - Infrastructure Failures: Use exponential backoff retries (e.g., when the provider returns 429 Rate Limited or 503 Service Unavailable, such as the throttling issues we encountered early in launch).
Set Retry Limits per Request
Without upper limits, a single anomalous request can lead to infinite retries, causing massive overhead. Therefore, every request must have a hard cap. There are several configuration methods: the simplest is a fixed number of retries, which we set to 3; if the third validation fails, further attempts are unlikely to succeed. Alternatively, limit total token consumption or time elapsed. Another approach is to limit retries based on specific error types. Regardless of the method, setting a ceiling prevents runaway costs and ensures system stability.
If there is no upper limit on retries, an abnormal request can cause infinite retries, generating enormous overhead. Thus, each request must have a hard cap. There are several ways to configure this: the simplest is a fixed retry count, which we set to 3; if the third validation fails, we stop. Other configurations include limiting total token usage or maximum elapsed time. In any case, establishing a boundary avoids uncontrolled resource consumption.
The platform encapsulates this logic, treating validation failures as distinct events that trigger specific retry strategies rather than generic re-attempts.
from google.adk.agents import LlmAgentclass CustomLlmAgent(LlmAgent): def __init__(self, *args, max_validation_retries: int = 3, **kwargs): super().__init__(*args, **kwargs) self._max_validation_retries = max_validation_retries @property def max_validation_retries(self) -> int: """How many times structured-output validation is retried before failing.""" return self._max_validation_retries async def _run_async_impl(self, ctx): """Run the agent with retry logic for validation errors. Both structured-output paths raise pydantic.ValidationError from inside ADK's _run_async_impl. This wrapper retries on validation errors up to max_validation_retries times, logging each failure before retrying. """ for attempt in range(self.max_validation_retries): try: async for event in super()._run_async_impl(ctx): yield event return # Success except ValidationError as exc: is_last_attempt = attempt == self.max_validation_retries - 1 logger.warning( "[%s] VALIDATION ERROR (attempt %d/%d): output failed %s validation " "(%d error(s)): %s%s", self.name, attempt + 1, self.max_validation_retries, getattr(self.output_schema, "__name__", "?"), exc.error_count(), exc.errors(include_url=False), " -- retrying..." if not is_last_attempt else " -- max retries exceeded", ) metrics.record_hallucination(get_current_user()) if is_last_attempt: raise Copy code
Figure 4. CustomLlmAgent Retry Loop (app/agent.py)
We log every failed attempt to ensure full transparency of hallucination-related metrics, and we throw a hard exception when the final retry fails. This ensures that callers never silently receive problematic data.
Tool call failures are handled through an entirely different mechanism. When an MCP tool reports an error, the raw error message is fed directly into the model's context window, allowing the model to self-correct and re-initiate the call. This loop is managed by ADK's built-in plugins and registered at the application layer, as shown in Figure 5.
from google.adk.plugins import ReflectAndRetryToolPluginapp = App( root_agent=root_agent, name="app", plugins=[ ReflectAndRetryToolPlugin(max_retries=3), ],)Copy code
Figure 5. ReflectAndRetryToolPlugin Registration (app/agent.py)
We delegate tool recovery logic to the framework because the failure information returned by tools is already structured data for the model. However, we strictly manage schema validation ourselves using Pydantic. Encapsulating and hiding the validation logic would compromise our core hallucination telemetry capabilities.
At this layer, we track two key metrics: the recovery rate (to determine if the validation retry loop is effective) and the amplification factor (to ensure retry costs remain controlled).
Prompt Versioning and Change Management
Treat prompt changes as code changes. Prompts are executable text; modifying a prompt alters the system's runtime behavior, yet these changes are not intuitively visible in standard code diffs. Even a single-sentence difference between two prompts can lead to significant variations in hallucination rates, latency profiles, and token costs—and there is no compiler to warn you when a new version performs worse.
The platform’s minimal foundational primitive: every prompt has a unique ID and version, and can be deployed independently of the application code that invokes it. Applications reference prompts by ID rather than using string literals directly. The platform stores all versions of each prompt, tracks which version is live, and provides rollback capabilities without requiring an application redeployment.
Each prompt registration includes a name, explicit version, content, creation timestamp, and tags. Registering a new version does not overwrite the old one but instead appends to the history and updates the pointer to the live version. Figure 6 illustrates two versions of docs_agent: the original v1.0.0 and its replacement, v2.0.0.
python
register_prompt(       name="docs_agent",       content="""You are a documentation lookup specialist. Your role is to:               - Answer questions about software libraries and frameworks               - Look up APIs, parameters, and usage patterns from their docs               - Ground every answer in the documentation, not from memory               - Say so explicitly when the docs do not cover a question               - Keep answers concise and cite the library/version used""",       version="1.0.0",       tags=["documentation", "lookup", "specialist"]   )   # Docs Agent Prompt -- v2.0.0 (active)   register_prompt(       name="docs_agent",       content="""You are a documentation lookup specialist. Your job is to answer questions about software libraries and frameworks using their current, official documentation -- never from memory.           You have two tools, used in sequence:           1. resolve-library-id            2. get-library-docs            Rules:           - ALWAYS resolve and fetch docs before answering any question about a specific API, parameter, version behavior, or usage pattern. Do not rely on training data for library details, which may be outdated.           - Ground every claim in the fetched documentation. When you give a code example or name a parameter, it must come from the docs you retrieved, not from memory.           - If the fetched docs do not cover the question, say so explicitly rather than guessing. Do not fill gaps with plausible-sounding but unverified API details.           - If you cannot resolve the library at all, tell the user the library wasn't found and ask them to confirm the exact name.           - Keep answers concise and cite which library/version the docs came from.           You do not author new documentation, run code, or search the open web. If a request falls outside documentation lookup, say it's out of scope for this agent.           Output format            - answer: your grounded answer, drawn only from the fetched docs.           - library_name: the library the answer is about (e.g. "FastAPI").           - version: the library version the docs reflect, or null if unknown.           - sources: one entry per docs lookup, each with the resolved library_id and the topic (or null).           - grounded: true only if every claim is backed by the fetched docs; false if the docs did not cover the question.           - out_of_scope: true if the request was not a documentation lookup.""",       version="2.0.0",       tags=["documentation", "lookup", "specialist"]   )

Do not include any text outside the JSON object.""",       version="2.0.0",       tags=["documentation", "lookup", "context7", "grounded"]   )
def rollback(self, name: str, version: str) -> str: """Repoint a prompt's active version to an existing earlier version. History is never deleted -- rollback only changes which version get_prompt(name) returns. Returns the version now active. Raises KeyError if the prompt or target version is unknown. """ if name not in self._prompts: raise KeyError(f"Prompt '{name}' not found in registry") if version not in self._prompts[name]: raise KeyError(f"Version '{version}' not found for prompt '{name}'") self._latest_versions[name] = version return versiondef _prompt_provider(name: str): return lambda _ctx: get_prompt(name)def classify_intent(user_input: str) -> Dict: """Classify user intent based on YAML keyword rules. Returns a structured decision the calling agent can act on: - matched: {"status": "classified", "agent": <name>, "score": <float>} - no match: {"status": "unclassified", "agent": None, ...} The request is left unclassified rather than defaulting to a fixed agent; the caller decides or asks the user. """ user_input_lower = user_input.lower() agent_scores = {} for agent_name, agent_rules in INTENT_RULES.get("agents", {}).items(): keywords = agent_rules.get("keywords", []) weight = agent_rules.get("weight", 1.0) score = sum(1 for kw in keywords if kw in user_input_lower) * weight agent_scores[agent_name] = score # No confident match: do NOT default to a specific intent. Hand control if not agent_scores or all(score == 0 for score in agent_scores.values()): return { "status": "unclassified", "agent": None, "reason": "No intent rule matched the request.", "available_agents": list(INTENT_RULES.get("agents", {}).keys()), "next_action": "ask_user_about_web_search", } best_agent = max(agent_scores, key=agent_scores.get) return {"status": "classified", "agent": best_agent, "score": agent_scores[best_agent]}Copy code
Figure 9. classify_intent gateway (intent_classifier/classifier.py)
Even with low confidence scores, standard routing forces requests to the highest-scoring agent. This is precisely why agents attempt to handle queries outside their capabilities, leading to hallucinations. The platform explicitly returns an "unclassified" status and selects safer subsequent actions: rejecting the request, asking the user for clarification, or degrading to strictly limited retrieval.
This approach yields dual benefits. First, the gateway intercepts requests prone to causing model hallucinations. Second, by pre-selecting appropriate tools and prompts, it narrows the scope of reasoning required from the model, thereby reducing hallucination rates while keeping the context concise and clear.
We designed the router as an independent, replaceable component. You can flexibly choose between a simple keyword-based gateway or a higher-precision trained classifier at the front end of the base model—for example, a Transformer fine-tuned via Hugging Face or a lightweight model built with scikit-learn.
Authentication and Authorization: Securing the MCP Layer
Most articles frame agent security primarily as a prompt injection problem. However, in multi-team deployment scenarios, a more critical yet simpler issue arises: when multiple teams' tools are deployed behind MCP servers and the platform is shared across various roles, which callers are permitted to invoke which tools? This is RBAC (Role-Based Access Control). It should be implemented at the platform layer, enforcing permission checks at the resource server side, rather than handling access control separately within each application.
The platform issues stateless JWTs upon login, signed using PyJWT. These tokens carry caller role claims. Any service holding the shared secret can verify the token and read the role without needing to call back to the authentication service. Figure 10 illustrates the platform's token issuance logic: writing caller identity and roles into short-lived JWTs allows downstream services to complete verification using the shared secret.
def issue_token(username: str, role: str, ttl_seconds: int = TOKEN_TTL_SECONDS): """Mint a signed token for an authenticated user.""" now = datetime.now(timezone.utc) payload = { "sub": username, "role": role, "iat": int(now.timestamp()), "exp": int((now + timedelta(seconds=ttl_seconds)).timestamp()), } token = jwt.encode(payload, JWT_SECRET, algorithm=JWT_ALGORITHM) return {"token": token, "token_type": "Bearer", "role": role, ...}Copy code
Figure 10. The issue_token function (gateway/authz.py)
Permission configurations are stored in YAML files rather than hardcoded rules, adopting a default-deny policy. Modifying security policies only requires updating the configuration, without needing a full redeployment. Figure 11 shows an example of the policy configuration.
developer: description: Development-only access (no production) permissions: tools: - read_file - list_directory - query_database resources: - "file://src/*" - "db://dev/*" - "db://staging/*" operations: [SELECT, GET, LIST] # Explicitly blocked: production databases, deployment, admin operationsCopy code
Figure 11. Authorization policies (gateway/policies.yaml)
One design decision I strongly adhere to is where policies should be enforced. A simple approach would be to validate permissions once at the gateway and then trust all downstream components, but we chose not to do this. Each MCP server built on FastMCP acts as an independent resource service: it independently validates tokens and checks policies before every tool call, as shown in Figure 12.
from fastmcp.server.middleware import Middleware, MiddlewareContextclass AuthzMiddleware(Middleware): """Deny tool calls whose caller role isn't permitted by the policy.""" async def on_call_tool(self, context: MiddlewareContext, call_next): tool_name = context.message.name auth_header = get_http_headers(include={"authorization"}).get("authorization") try: claims = decode_token(token_from_header(auth_header)) except AuthError as exc: raise ToolError(f"Unauthorized: {exc}") role = claims.get("role", "") if not policy_engine.can_access_tool(role, tool_name): logger.warning("MCP authz DENY role=%r tool=%r", role, tool_name) raise ToolError( f"Forbidden: role '{role}' is not authorized to use tool '{tool_name}'" ) return await call_next(context)Copy code
Figure 12. The AuthzMiddleware validation entry point (mcp_server/authz_middleware.py)
LLM Observability
Standard APM (Application Performance Monitoring) was the most costly pitfall we encountered. Latency, error rates, and throughput can only determine whether the model is reachable, but they provide no insight into whether the model's behavior is normal.
Production-grade LLM systems truly need these metrics:
- Hallucination Rate: The percentage of AI responses that violate format rules (Schema failures) or fabricate facts not present in the documentation (Provenance failures), tracked by application and prompt version.
- Prompt Drift: The rate of behavioral change between different prompt versions. If a new version increases the hallucination rate by 2%, it must be detected before deployment.
- Cost Optimization: Break down token costs by team, application, and scenario to automatically identify high-cost scenarios.
- Tool Invocation Behavior: Which tools agents invoke, invocation order, failure rates, and rejection rates. Issues in multi-agent pipelines often surface here.
- Behavioral Correctness Sampling: Sample production traffic for offline evaluation against standard benchmarks; see the "Evaluating Agent Behavior" section below.
- Correlate per-request success rates and user-level latency with traditional operational metrics to link AI semantic quality with system health.
Key implementation detail for "team-based reporting": Team identity data must be injected at the request entry point; it cannot be reconstructed from logs after the fact. The collector resolves team information based on authentication roles and stores it in context variables set at the request entry point. Every record is traceable to its owner, eliminating the need to pass team IDs throughout business code. Figure 13 illustrates this attribution model: roles map to teams, while user requests, token consumption, costs, and hallucination counts are aggregated into a single user record.
ROLE_TEAM: dict[str, str] = { "viewer": "shared", "analyst": "analytics", "developer": "developer", "deployer": "devops", "admin": "platform",}@dataclassclass UserMetrics: user_id: str team: str = "unknown" requests: int = 0 successes: int = 0 errors: int = 0 hallucinations: int = 0 input_tokens: int = 0 output_tokens: int = 0 total_cost_usd: float = 0.0 total_latency_s: float = 0.0Copy Code
Figure 13. ROLE_TEAM mapping and UserMetrics record structure (observability/metrics/collector.py)
Token consumption is recorded at each model call site, not just when the final response is returned. This collection logic is implemented within the agent's after_model_callback. Consequently, when a request is dispatched to four expert sub-agents, all four model calls are attributed to the same user and team. The hallucination counter within the same record is incremented by Schema validation logic. Latency data and success/failure counts originate from a context manager wrapping the gateway execution endpoint. A snapshot endpoint generates full metrics broken down by user or team. Figure 14 shows a real-world snapshot for a single user in production: the same attribution record includes token usage, cost, latency, and success rate.
{ "user_id": "dale", "team": "devops", "requests": 1, "successes": 1, "errors": 0, "hallucinations": 0, "input_tokens": 191, "output_tokens": 79, "total_cost_usd": 0.0, "total_latency_s": 11.145345083001303}Copy Code
Figure 14. Example user metrics snapshot (observability/metrics/collector.py)
We track local token estimates separately from actual API-reported data to ensure internal counters do not conflate with billing records.
We use OpenTelemetry to report metrics but encapsulate them within custom methods. This allows us to swap backends (e.g., Prometheus) without modifying business code.
Evaluating Agent Behavior
Unit tests and contract tests can lock down deterministic logic, but they cannot answer the most critical question for LLM systems: Is the model behaving correctly? The evaluation layer addresses this gap and is arguably the most important component to build carefully, serving as the regression test suite for the agent platform.
The workflow consists of four parts: a representative benchmark test case set, an executor that drives real agents through these cases, scoring metrics, and thresholds that convert scores into pass/fail decisions.
The benchmark test case set is data, not code. In the repository, it is a JSON file. Each case defines expected outcomes, including the user request, the tool invocation trajectory the agent should execute, the expected response, and the role executing the request. Base test cases cover routing contracts: document-related requests should identify intent and delegate to the Document Agent; code review requests go to the Code Agent; research requests go to the Research Agent. In production, this set grows continuously. Every user-facing incident adds a new test case, ensuring similar issues are not reintroduced.
The executor uses ADK's. It runs the actual agent for each use case, executing each case multiple times and averaging the scores. Repeated execution is crucial because models exhibit stochastic behavior, making single-run results of limited reference value. ADK provides metrics covering two major evaluation dimensions: first, whether the agent selected the correct path (tool call trajectory, i.e., whether it completed intent classification and routed to the corresponding expert agent); second, whether it output the correct answer (comparing the response against reference results while using model-based scoring to derive a quality score).
Thresholds turn evaluation results into admission gates rather than just dashboards. The codebase requires that the average tool call trajectory score across multiple runs must reach at least 0.8; falling below this score causes the evaluation to fail. This threshold is defined in a simple configuration file rather than buried deep within the code, allowing adjustments to evaluation criteria to go through a review process.
Two design choices give this evaluation system practical value. First, tiered testing is enforced in the continuous integration pipeline: fast, closed tests run on every code commit and serve as merge gates. Large model evaluations that depend on model and tool services are triggered separately, serving as gates for prompt releases. This avoids consuming online model resources on every code commit, yet ensures any prompt must pass evaluation before entering production. Second, the benchmark test case set includes self-validation: lightweight checks (without calling models) are executed on every code commit to verify that each case still adheres to valid contract conventions and that all metric names are recognized by the executor, ensuring the evaluation suite remains compliant with specifications on every run.
Combined with a prompt registry, this design achieves closed-loop management of prompt changes. Candidate prompts are evaluated against the benchmark case set before release. If the tool call trajectory score or fact-anchoring score is lower than the current production version, the prompt will not be published. Thus, "prompt drift" shifts from being a post-incident retrospective item to a pre-deployment quality gate. The hallucination metrics mentioned in this article adopt the same evaluation logic: assessing sampled traffic from production against the same ground truth. Figure 15 shows one case from the benchmark case set: it includes the user request, the complete tool call trajectory the agent should execute, and the execution role.
# tests/evals/data/root_agent.evalset.json -- one golden-set case (abridged).{ "eval_id": "docs_lookup_routes_to_docs_agent", "conversation": [{ "user_content": {"parts": [{"text": "Write documentation explaining the FastAPI routing API."}]}, "final_response": {"parts": [{"text": "Routed to the documentation specialist, which grounds its answer in the FastAPI docs."}]}, "intermediate_data": { "tool_uses": [ {"name": "classify_intent", "args": {"user_input": "Write documentation explaining the FastAPI routing API."}}, {"name": "transfer_to_agent", "args": {"agent_name": "docs_agent"}} ] } }], "session_input": {"app_name": "app", "user_id": "eval_user", "state": {"user_role": "viewer"}}}Copy Code
Figure 15. Benchmark Evaluation Case (tests/evals/data/root_agent.evalset.json)
As shown in Figure 16, the thresholds determining pass/fail status are written in a three-line configuration file. The average tool call trajectory score obtained from multiple runs must reach 0.8; otherwise, the evaluation is judged as failed.
{ "criteria": { "tool_trajectory_avg_score": 0.8 } }Copy Code
Figure 16. Evaluation Thresholds (tests/evals/data/test_config.json)
Architectural Patterns for Multi-Team Deployment
When multiple teams develop on the same platform, the problem shifts from "how to serve this model" to "how to support N teams sharing infrastructure." The three most important patterns are:
- Gateway Pattern: A single entry gateway handles authentication, tenant rate limiting, routing to the correct models and prompts, and observability data reporting. This applies the API Gateway pattern from the microservices domain to large model traffic scenarios.
- Agent Orchestrator Pattern: To prevent cascading failures, multi-agent pipelines must have a unique orchestrator controlling the overall topology. Without centralized control over circuit breakers, timeout budgets, and cross-node data validation, individual agents would attempt error recovery independently. Once an upstream issue occurs, agents blindly retry upstream components, spreading single-point failures into global system crashes.
- Cost Attribution Model: Every request entering the platform carries tags for team, application, and business use case. These tags propagate to all downstream model calls. This is a prerequisite for implementing per-team cost dashboards and must be incorporated into the design from the start.
Summary
To summarize this article, here are six specific decisions arranged by priority:
- Build the observability layer before your first production deployment, not after an incident occurs. Ignoring observability in v1 is the most expensive shortcut you can take. Without behavioral metrics, you won't detect system quality degradation until users complain—at which point trust has already been eroded.
- Adopt a platform mindset before launching your second application, rather than waiting until the tenth. Any common capabilities hardcoded into application logic will eventually need to be refactored and extracted under tight deadline pressures.
- Implement version control for prompts from day one. A registry based on ID references is cheap to implement; retrofitting it after silent regression incidents occur is far more costly—and such incidents are virtually inevitable.
- Enforce schema validation at the platform boundary during the first API call, rather than after the first downstream parsing failure. Otherwise, every consumer will have to write defensive parsing code.
- Add cost attribution tags to all requests from the start. Without team-level tagging, investigating overhead when management asks takes weeks; with proper tagging, you can simply check the dashboard.
- Build benchmark evaluation sets for each expert agent before making any prompt changes, not afterward. While a prompt registry enables quick rollbacks, benchmark suites allow you to identify that a rollback is necessary before issues impact users.
The underlying logic of these decisions: LLM systems encourage deferring infrastructure decisions in ways traditional systems do not. They don’t crash or return 500 errors; they simply degrade in output quality. The latency between decision errors and fault exposure is precisely why investing early in platform engineering yields benefits, while rushing to retrofit after incidents occur incurs massive costs.
Complete, runnable code for all foundational components mentioned in this article is available in this repository.
View the original English article: https://www.infoq.com/articles/platform-engineering-playbook-production-llms/