新智元 (微信公众号) · 10/15/2026, 20:48:00
Tsinghua Open-Sources Puro-2B: Low-Cost Pretraining on RTX 5090 Clusters
Tsinghua University released Puro-2B, a fully open-source low-cost pretraining pipeline. By utilizing an RTX 5090 cluster, the team trained a 2B-parameter model for approximately $4,400, drastically lowering the computational barrier for small teams to replicate large-scale LLM pretraining.
SOURCE COVERAGEFull Original Report
You can't afford to train a 2.8T parameter K3, and you've had your fun with the 124M parameter nanoGPT. Now, you want to try pre-training a model with billions of parameters on trillions of tokens. How high is the barrier to entry?
Models of this scale are widely used, such as the classic Qwen series (Qwen2-1.5B, Qwen2.5-1.5B, Qwen3-1.7B, etc.).
However, while the Qwen series has open-sourced its weights, it has not fully disclosed its pre-training recipe. Projects like OLMo and SmolLM have gone further by open-sourcing their data and training details, but reproduction remains expensive: estimates suggest that even for billion-parameter models, reproducing OLMoE-1B/7B and SmolLM3-3B requires computational costs of approximately 719,000, respectively.
For ordinary labs, knowing "how to train" isn't enough; they also need to be able to "afford to train." We need a low-cost, reproducible "budget-friendly" pre-training solution.
Puro-2B
A Fully Open-Source "Budget-Friendly" Pre-training Solution
Addressing this challenge, Professor Chen Wenguang and Professor Lü Kaifeng's team at Tsinghua University jointly launched Puro-2B, a fully open-source pre-training solution. They have open-sourced the training data, training framework, training configurations, and model weights.
Figure 3 from the paper | The Puro-2B "Budget-Friendly" Training Pipeline
They trained a model with approximately 2 billion parameters from scratch on a compute cluster equipped with consumer-grade RTX 5090 GPUs, utilizing up to 1.4 trillion tokens.
In comprehensive evaluations covering 15 tasks, using this approach, the model surpassed Qwen2-1.5B in average metrics across the 15 tasks with a pre-training compute cost of only ~6,900, approached the average performance of Qwen2.5-1.5B. Compared to other open-source solutions, Puro-2B significantly reduces training costs.
Paper Link: https://arxiv.org/pdf/2608.27370
Open Source Materials Collection: https://huggingface.co/collections/thu-pacman/puro-2b
Model & Intermediate Checkpoints: https://huggingface.co/collections/thu-pacman/puro-2b
Training Data & Mixing Ratios: https://huggingface.co/datasets/thu-pacman/Puro-2B
If you have less budget, what level of performance can you achieve? To answer this, the team fitted a cost-performance curve based on multiple checkpoints.
As shown in Figure 4 below, the curve indicates that with a budget of just $1,000, you can train a model that outperforms Qwen2-1.5B on most tasks.
Paper Figure 2b | Puro Cost Scaling Law
This low-cost solution stems from a co-design across five key areas: hardware selection, low-precision training, optimizer improvements, high-quality data utilization efficiency, and data selection.
Higher Compute Power per Unit Cost
Compared to other open-source training solutions, the Puro-2B team started from more fundamental, lower-level, and practical questions:
How much compute power can we buy with the same budget?
Based on the GPU rental prices adopted in the paper, they found that the BF16 peak compute power per dollar of the RTX 5090 is approximately 2.77 times that of the H200. This means that, per unit cost, the RTX 5090 delivers significantly more compute power than widely used data center cards, while also offering better hardware accessibility as a consumer-grade GPU.
Simplified Paper Table 2 | Statistics and Comparison of Compute Price Ratios for Different GPUs
However, the RTX 5090 has only 32GB of VRAM and lacks NVLink, meaning data center GPU training configurations cannot be directly copied.
The Puro-2B team enabled PCIe P2P communication within nodes through driver and system configuration adjustments, increasing inter-GPU unidirectional bandwidth from 31.5 GB/s to 56 GB/s, and reducing communication latency from 14.3 µs to 0.4 µs.
They enabled GPU Direct RDMA between nodes, boosting the AllReduce bus bandwidth for 24 GPUs from 8.87 GB/s to 19.93 GB/s.
Puro’s training strategy was also optimized for billion-parameter scale computational loads and the specific hardware characteristics of the RTX 5090: they adopted a combination of data parallelism and pipeline parallelism, avoiding tensor parallelism which incurs frequent communication overhead.
By redistributing the computational load across pipeline stages, adjusting micro-batch sizes, and balancing the placement of optimizer states according to VRAM usage, they balanced the memory load across different nodes.
Through these optimizations, the overall Model FLOPs Utilization (MFU) exceeds 70%, converting the cost-performance advantage of consumer cards into a training cost advantage via engineering adaptations and system optimizations.
With more cost-effective compute power secured, the next step is to improve computational precision efficiency.
Leveraging FP8 for RTX 5090’s Low-Precision Efficiency Advantage
The Blackwell architecture of the RTX 5090 also provides a foundation for FP8 training. They followed DeepSeek-V3’s fine-grained block-wise quantization approach, placing matrix multiplications in major linear layers on the FP8 path, while retaining BF16 or FP32 precision for numerically sensitive operations and training states.
FP8 introduces some precision loss. To determine if this trade-off is worthwhile, they verified the net efficiency gains of FP8 training through controlled experiments across different model scales (Scaling ladder).
Through experimental comparisons across five model scales, they found that compared to BF16, FP8 validation loss is higher by approximately 0.0031–0.0039, but the gap is small and stable across scales.
Meanwhile, FP8 training throughput improved by 1.36 times; after accounting for the additional computation required to reach the same loss level due to precision loss, an estimated 1.34 times net efficiency gain remains.
Paper Figure 10b | FP8 Loss Gap and Quality-Corrected Efficiency
From Standard Learning Rate to Effective Learning Rate
Once computational precision is determined, the design of the optimizer and learning rate impacts the effectiveness of each update step. The optimizer determines the direction of each update, while the learning rate determines the step size.
They adopted the emerging MuonH optimizer: building upon Muon, it normalizes the weight update magnitude and projects weights back to a fixed radius after updates, thereby simultaneously controlling both the update norm and the weight norm.
As a result, the Effective Learning Rate (ELR)—which measures the update magnitude relative to the weight scale—can be explicitly preset, rather than indirectly drifting due to changes in weight scale during training.
Paper Figure 4 | Schematic of MuonH Principles and Comparison with Muon
Their key observation came from a set of controlled experiments: when using standard Muon without fixed-radius weight projection, but dynamically adjusting the learning rate to align the ELR trajectory with that of MuonH, the loss curves nearly coincide.
This indicates that the practical advantages of MuonH cannot be attributed solely to norm constraints; the evolution of the Effective Learning Rate (ELR) is a key clue for understanding the effectiveness of hypersphere optimization.
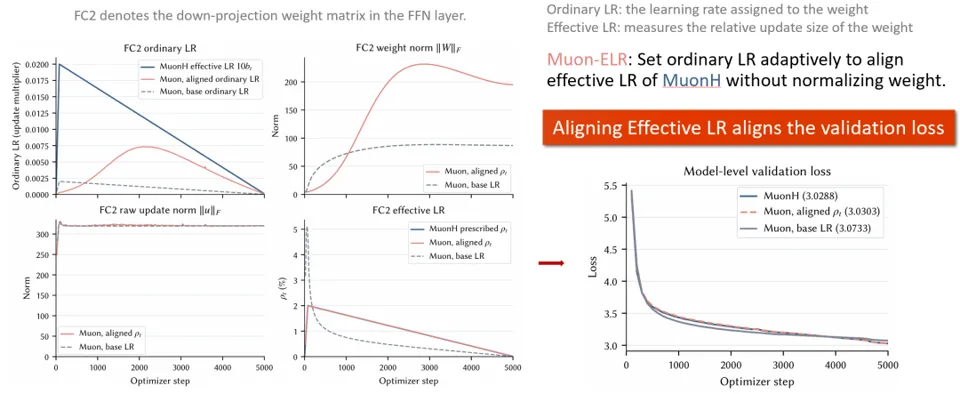
Synthesis of Paper Figure 5 and Figure 15 | Explanation and Comparison of ELR Alignment Experiments
Further comparison reveals that when weight decay provides insufficient constraint on weight norms, the standard Muon optimizer’s ELR drops faster in the early stages, leading to earlier loss reduction. In contrast, MuonH maintains a more gradual decay, resulting in better performance in the later stages.
This shifted their focus from “which optimizer to use” to “how to design a more reasonable Effective Learning Rate (ELR) schedule.”
Subsequently, they conducted ablations on peak learning rates and training data volume relative to the proportion of the decay phase during training. The results showed that higher peak learning rates and longer training cycles typically require a longer decay process.
Therefore, they adopted a power schedule in the first stage of training, which does not rely on a preset endpoint and supports continuous training. In the second stage, they employed a long linear decay, leaving room for final loss convergence.
Comparisons based on the Scaling Ladder further demonstrated that the MuonH scheme achieves approximately 1.19x training efficiency compared to the tuned Muon baseline.
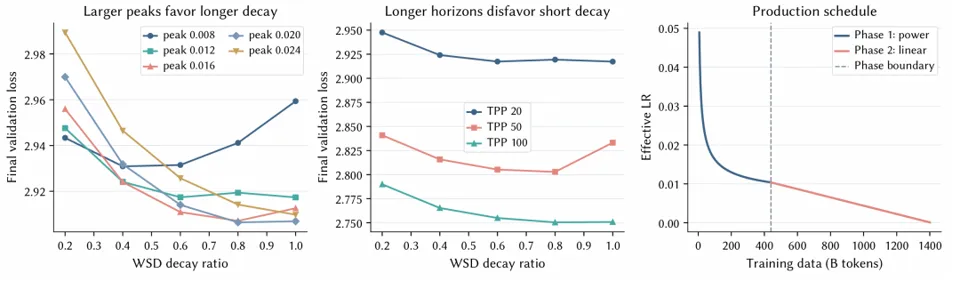
Paper Figure 6 | Learning Rate Design
Paper Figure 10a | Ablation on MuonH Training Efficiency
Place High-Quality Data in Later Training Stages
And Ensure the Model Can Learn Effectively
Beyond the optimizer, data efficiency is also influenced by data arrangement. High-quality data constitutes a small but critical portion of the training dataset; placing it in later training stages helps improve utilization efficiency. Many open-source datasets provide quality scores for samples.
The Puro team leveraged these signals to arrange higher-quality samples toward the end of the training sequence within each data source, then aligned and mixed data blocks from different sources according to training progress.
This approach ensures that the dataset gradually transitions to higher-quality intervals during training while maintaining approximate stability in local training interval data ratios, avoiding sudden shifts in domain data proportions caused by quality changes.
However, arranging the data correctly does not guarantee that the model can fully learn from it. Previous research by the Puro team found that: when the learning rate is too low in the late stages of training, high-quality data appearing at the end struggles to drive parameter updates. To address this, they adopted Curriculum Model Averaging (CMA), maintaining a constant learning rate in the late stages to allow the model to continue learning from high-quality data, followed by weight averaging of checkpoints at the end to mitigate training noise introduced by the higher learning rate.
Paper Figure 7 | Curriculum Data Construction and Model Averaging
Further ablations showed that performing model averaging directly on training trajectories with decaying learning rates does not yield stable benefits. What truly needs to be coordinated are the data order, late-stage learning rate, and model averaging strategy.
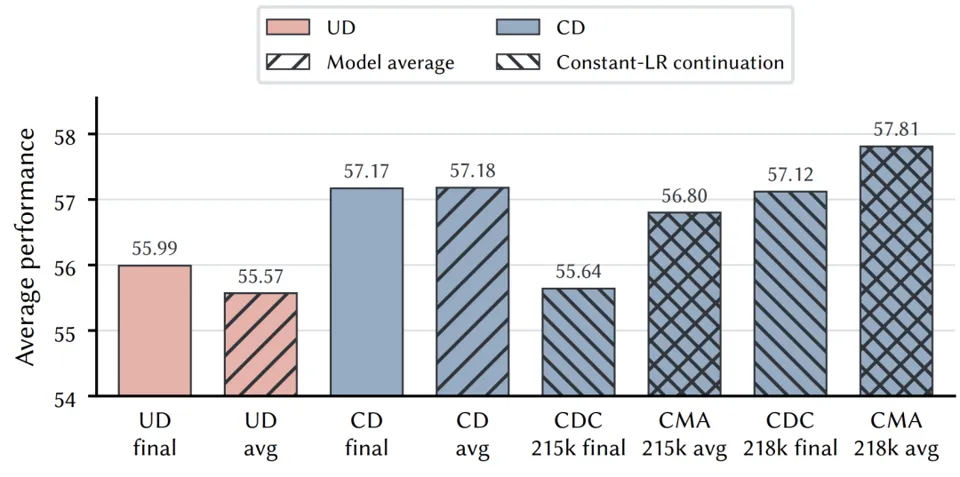
Figure 13b | Ablation Experiments on Data Order, Late-Stage Learning Rate, and Model Averaging Strategy
Based on estimates using the empirical curve of the Puro Cost Scaling Law, compared to uniform data distribution (Uniform, UD), data curriculum combined with learning rate decay improves cost efficiency by approximately 1.65x, while the complete CMA scheme reaches about 2.40x.
Data Evaluation
After addressing data ordering, the next step is deciding which data to select.
They established a hierarchical comparison workflow: "Data Source — Data Slice — Capability Evaluation." For large-scale datasets with scores, they extracted data slices from different score intervals.
For other eligible data sources, random slicing was used. Each candidate slice started from the same checkpoint, continued training under identical configurations, and was evaluated using fixed benchmarks to assess multidimensional performance in mathematics, code, Chinese, and general capabilities.
This allows for comparing different data sources as well as identifying quality differences within the same source. Small-scale proxy experiments also revealed that, relative to mathematical capability, coding capability has a greater negative impact on general capability.
Based on this, they appropriately increased the proportion of mathematical data in the second stage, while determining the final mix through domain coverage and quality filtering.
These small-scale experiments provided reference points for "which data to select, which score intervals to retain, and what proportions to allocate to different sources." Related dataset evaluation results have been published in the report.
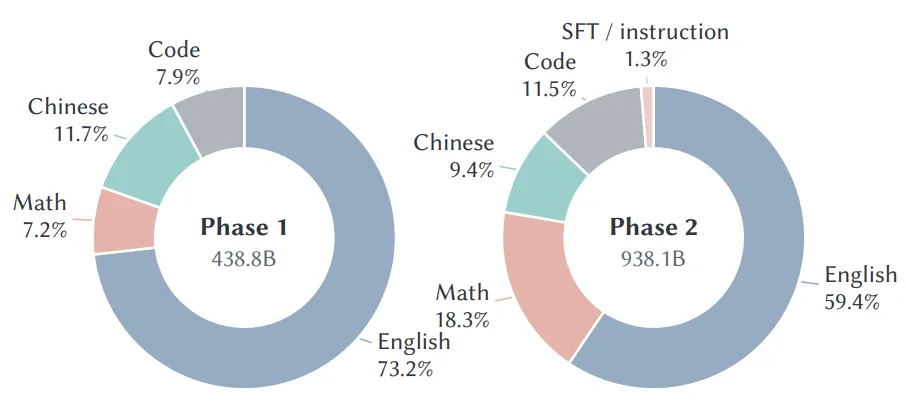
Paper Figure 9 | Proxy evaluation pipeline; Figure 8 | Two-stage data mixing ratio
From Saving Compute to Covering the Entire Training Pipeline
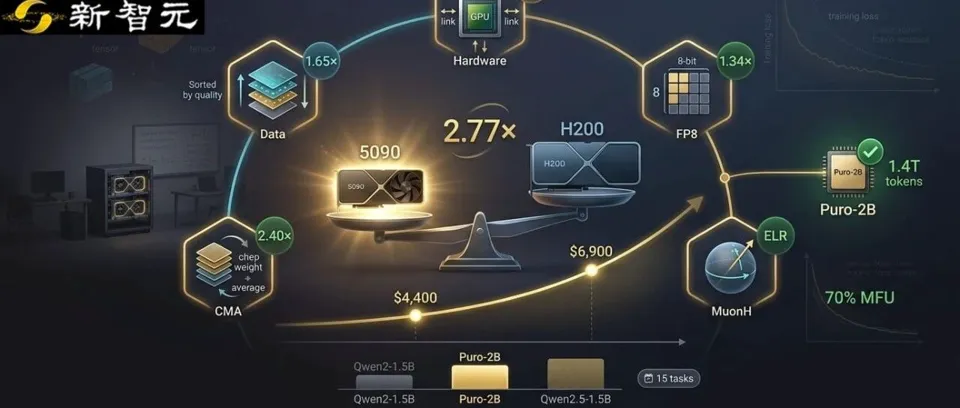
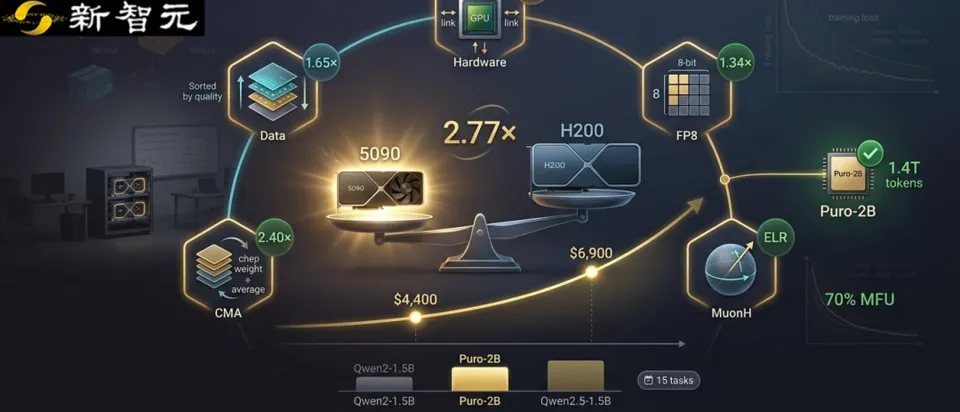
Looking back at the overall solution, each component addresses efficiency issues at different levels: hardware reduces the cost per unit of computation, FP8 increases peak compute throughput to shorten execution time, MuonH accelerates loss convergence, CMA improves the utilization efficiency of training data, and proxy evaluation helps select data that is more worthwhile for training. Together, these improvements constitute Puro's low-cost training pipeline.
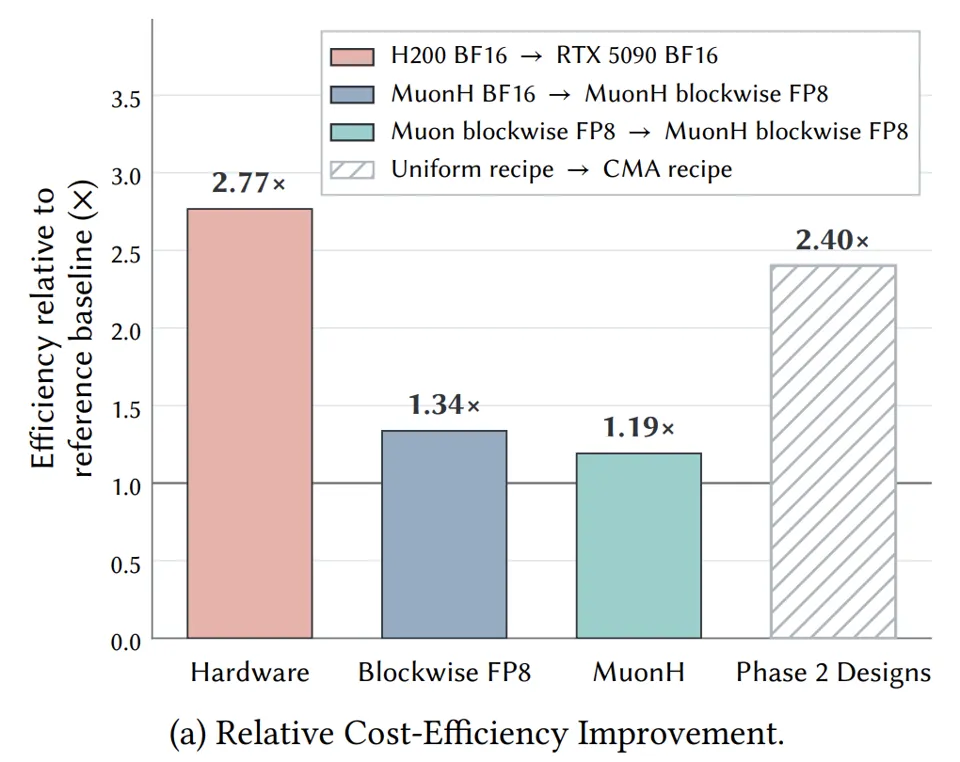
Paper Figure 2a | Summary of efficiency gains from each component
So, how can this training recipe be applied in research or practice? For example, researchers can control the pre-training process and then verify the post-training results.
One key use case is: Researchers often care whether methodological improvements made during the pre-training stage remain effective after post-training. If only open-source weights are available, it is difficult for researchers to control the model's prior pre-training process. However, Puro-2B makes modifying pre-training methods, continuing with fine-tuning, and verifying final performance a runnable and affordable experimental workflow.
The Puro team applied an identical fine-tuning pipeline to weights initialized via CMA and Uniform pre-training. In two sets of math capability fine-tuning experiments, models fine-tuned from CMA-initialized weights achieved GSM8K accuracy scores higher by 1.77 and 2.02 percentage points, respectively. In Tulu-3 mixed-domain fine-tuning, the average score across 15 benchmarks increased by 1.17 percentage points, and IFEval improved by 1.36 percentage points.
All three controlled comparisons showed overall improvements, indicating that the advantages of CMA generally persist through post-training. Thus, Puro-2B provides not just a model with higher scores, but also a foundational pre-training pipeline for testing whether pre-training methods yield ultimate benefits.
Paper Figure 11 | Comparison of fine-tuning results using weights from CMA vs. Uniform data pre-training
The name "Puro" (meaning "common people" or "the masses" in Chinese context) suggests a connection to accessibility for everyone. Will model vendors continue to race ahead on the path of scaling up, or will model training gradually become accessible to the general public? Puro's attempt may be making it possible for more teams to participate in pre-training research.
References:
https://arxiv.org/pdf/2608.27370
Chasing ASI Instantly
⭐ Like, Share, and Watch – The Triple Combo ⭐
Star us to lock in AI Era's instant updates!