GitHub Unveils Rubicon Storage Architecture for 5,000 Concurrent Agents
GitHub unveiled Rubicon, a new Git storage architecture that internal stress tests show can sustain 5,000 concurrent agents and 7,200 pushes per second in a single repository, with read capacity scaling horizontally on demand. The architecture is in limited private preview, with broader rollout planned for early next year, aimed at the sustained high-throughput load created by always-on AI agents.
Full Report
IT之家 November 7 news — On November 5 local time, GitHub published a blog post stating that at the GitHub Universe conference last week, it officially unveiled a brand-new Git storage architecture, codenamed "Rubicon."

According to the official announcement, the architecture not only has the capacity to handle thousands of writes per second, but also enables on-demand horizontal scaling for reads. Verified through internal stress testing, the new architecture can maintain extremely low read latency while supporting a single repository to accommodate 5,000 agents collaborating concurrently, and withstand code pushes of up to 7,200 per second.
IT之家 has learned that the architecture has now entered a limited private preview, with plans to gradually expand availability starting early next year.
According to the introduction, the busiest repositories on GitHub today see peak write rates of at most a few dozen per second, and these often come in short, bursty spikes. However, as more and more development work is handed over to AI agents running around the clock with high concurrency, it is expected that within the next year, such transient bursts will evolve into常态化 sustained high-throughput loads.
Every code push cascades into more read requests: CI pipelines kick off immediately, deployment systems pull the latest commits, and other collaborating agents also fetch code as context. This read fan-out, as write frequency climbs, produces a very significant amplifying effect on the platform's overall traffic.
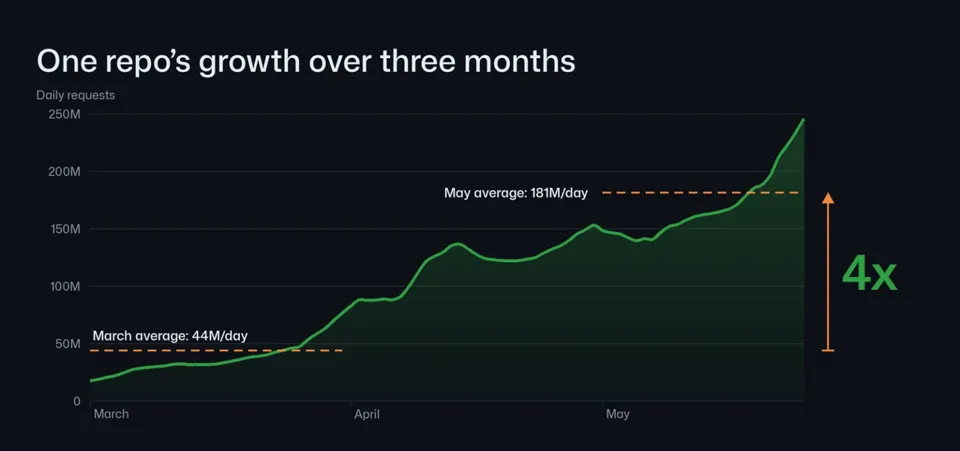
This trend is already evident among the top repositories at the very head of the traffic distribution curve. The chart below shows the daily request volume changes for a typical repository on GitHub between March and May — in just two months, its traffic surged by roughly 4x; since then, its access growth has continued to maintain a steep exponential upward trajectory.