Alibaba Proposes Benchmark Health Index to Quantify LLM Evaluation Validity
An Alibaba Data team presented an Oral paper at NeurIPS 2026 introducing the 'Benchmark Health Index' (BHI). Based on 158 benchmarks and 117 model reports, the framework evaluates benchmark validity across capability discrimination, saturation resistance, and impact, addressing issues like score compression and ceiling effects caused by advancing model capabilities.
Full Report

BHI provides a continuously updatable reference for evaluating the validity of benchmarks.

As model capabilities improve, model evaluation faces new challenges.
Some benchmarks are approaching saturation, making it increasingly difficult to differentiate models by score, which in turn reduces the value of benchmark results. Which benchmarks remain effective? What do the scores still tell us?
To address this issue, a research team from Alibaba Data proposed answers in their paper Benchmark Health Index: A Systematic Framework for Benchmarking the Benchmarks of LLMs. The paper has been accepted as an Oral presentation at the NeurIPS 2026 Evaluations and Datasets Track, one of only 15 Oral papers in that track this year.
Based on technical reports from 117 models, the team curated and filtered 158 evaluation benchmarks to propose the Benchmark Health Index (BHI). BHI assesses these "rulers" for model evaluation across three dimensions—capability discrimination, resistance to saturation, and impact—to determine whether they still provide meaningful comparative insights into model performance.
- Paper Title: Benchmark Health Index: A Systematic Framework for Benchmarking the Benchmarks of LLMs
- Authors: Longyuan Zhu, Hairan Hua, Linlin Miao, Wei Wang, Bing Zhao
- Institutions: Alibaba Data, Skyeval (https://skyeval.com)
- Acceptance: NeurIPS 2026 Evaluations and Datasets Track (Oral)
Are the rulers for evaluating models still effective?
On some benchmarks, top-tier models' scores are converging, leading to "score compression." Small differences may be attributable to statistical noise, making it difficult to effectively distinguish true model capabilities.
Long-standing fixed evaluation questions may have been included in pre-training data; high scores achieved through prior exposure may no longer reflect genuine capability. As model scores approach upper limits, the challenge space of benchmarks shrinks. A benchmark that can distinguish models today may become saturated tomorrow, exhibiting a "ceiling effect."
These issues make the update and selection of evaluation benchmarks particularly critical.
Simply switching to harder questions is not necessarily effective. If all models fail to answer correctly, scores still cannot be differentiated.
Citation counts are also not the most reliable indicator for selection. Some benchmarks are frequently cited but not widely adopted by leading models—a case of "decoupling between popularity and adoption."
How can we filter for high-quality benchmarks that still effectively discriminate model capabilities and offer sustained evaluation value? First, we must clearly identify where the problems lie.
Giving Evaluation Benchmarks a "Health Check"
Among the 158 benchmarks analyzed in the paper, BHI's systematic diagnosis focuses on three key questions.
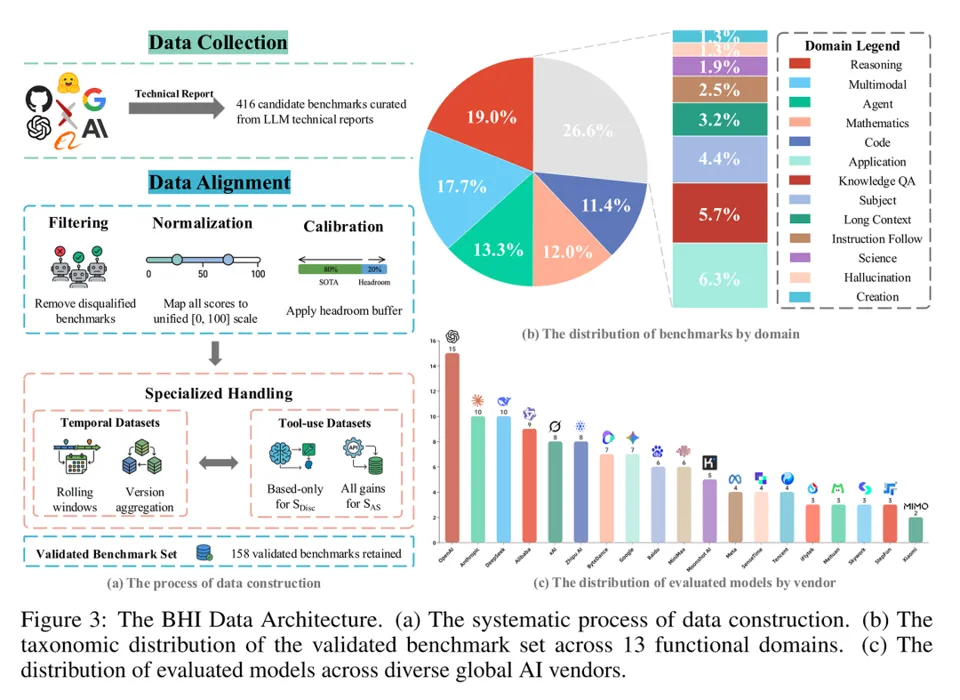
Construction and distribution of BHI research data. Left: Benchmark filtering and alignment process. Top right: Distribution of benchmarks across 13 task domains. Bottom right: Number of models included in analysis per vendor.
Can the benchmark differentiate model gaps?
"Capability Discrimination" measures whether scores clearly reveal differences between models, avoiding misinterpretation of small score gaps or extreme outliers as evidence of discriminative power.
BHI first calculates the proportion of model pairs with score differences exceeding a threshold set at 2% of the range between the highest and lowest scores. It then examines the score span between the 10th and 90th percentiles to observe distances among the majority of models. Higher proportions and larger spans indicate better differentiation of model performance.
These two metrics are normalized and weighted to synthesize the Capability Discrimination score. A higher score indicates that the benchmark better distinguishes models within the collected records; however, exceeding the threshold does not imply that the differences have passed statistical significance tests.
How much room for improvement remains in the benchmark?
"Resistance to Saturation" considers not only whether model scores are close to perfect but also the capabilities of participating models. Low average scores might indicate a difficult benchmark or weak participating models, so they do not directly prove sufficient challenge space.
It weights scores based on model capability to estimate remaining headroom. Simultaneously, it fits trends in scores over time and extrapolates forward by 30 days to judge whether the benchmark is approaching saturation.
The two components are combined with an 8 ratio, giving greater weight to the current state to reduce the impact of short-term prediction uncertainty.
A higher Resistance to Saturation score indicates that, within the collected evaluation records, the benchmark retains significant challenge space; however, it does not guarantee accurate prediction of when saturation will occur.
What is the actual adoption coverage of the benchmark in real-world evaluations?
The "Impact" metric looks beyond mere visibility. Metrics such as citation count, download volume, and repository stars do not directly contribute to this index.
It counts models that provided valid scores in reports and weights adoption based on model capability. Benchmarks adopted by frontier models receive higher weights, reflecting usage patterns in high-capability model evaluations.
Furthermore, this metric does not rely on publication dates of benchmarks or models, nor does it use heuristic time decay. Instead, it calculates based on actual adoption, reducing interference from accumulated historical popularity.
Thus, a higher Impact score indicates that more capable models continue to actively use this benchmark within the evaluated practices.
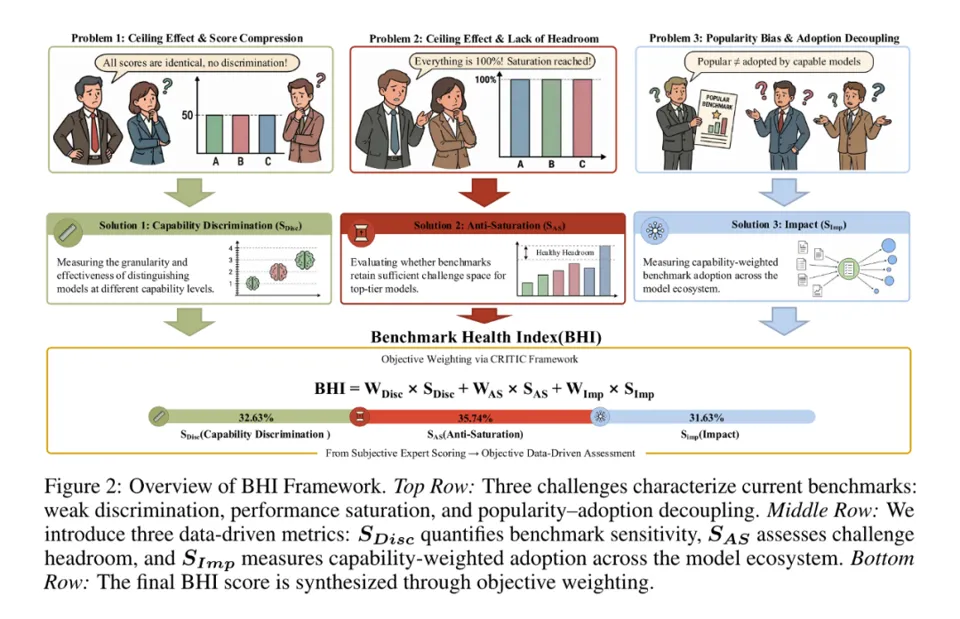
Synthesis method of BHI. The CRITIC method determines weights for the three dimensions based on data: Capability Discrimination accounts for 32.63%, Resistance to Saturation for 35.74%, and Impact for 31.63%.
But who judges model capability?
If we use scores on a specific benchmark to estimate model strength, and then use that estimate to evaluate the same benchmark, we fall into circular reasoning.
To avoid this, the research team employed LOBO (Leave-One-Benchmark-Out): when examining a specific benchmark, it is excluded, and model capability is estimated using performance on other benchmarks.
Finally, the CRITIC method determines weights based on the information content and correlation of each dimension to synthesize the BHI. The total score allows for comparison, while the three individual dimensions help clarify the sources of differences.
Who is still sharp, and who is already saturated?
Synthesizing the evaluation results across three dimensions, BHI provides a comprehensive ranking of current mainstream benchmarks:
Humanity's Last Exam (HLE) ranks first with a BHI score of 67.05, followed by Agents' Last Exam and AutomationBench in second and third place, with scores of 53.08 and 52.68, respectively.
HLE’s advantage is not concentrated in any single dimension. It effectively differentiates between models, retains significant headroom for challenge, and enjoys broad adoption coverage weighted by capability.
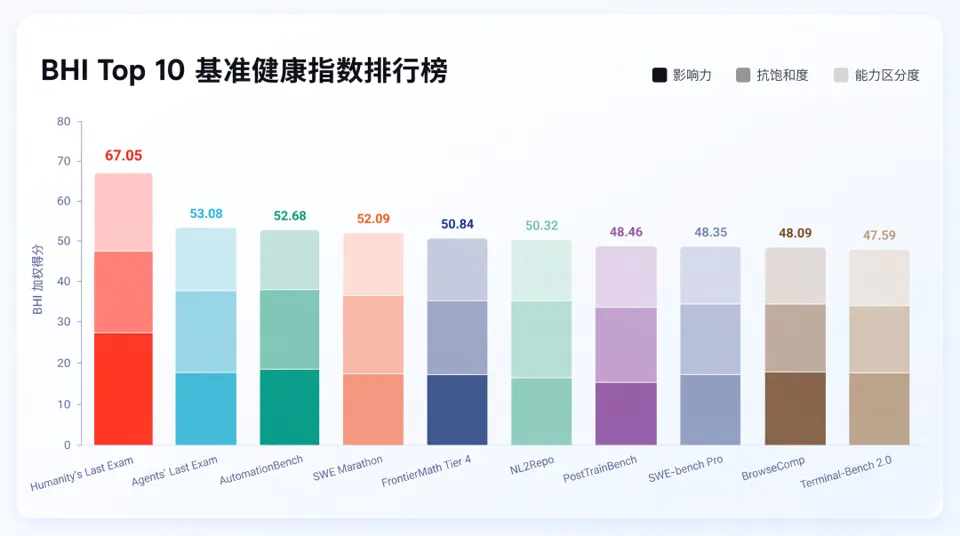
Top ten benchmarks by composite BHI score. The top of each bar represents the composite score, while the colored segments indicate the weighted contributions from the three dimensions.
Benchmarks with similar total scores may excel in different areas.
AutomationBench trails fourth-ranked SWE Marathon by only 0.59 points, yet it exhibits higher resistance to saturation, whereas SWE Marathon offers greater discriminative power. Remaining challenge space and current discriminative ability do not always align.
The gap between eighth-ranked SWE-bench Pro and ninth-ranked BrowseComp is even smaller, with scores of 48.35 and 48.09, respectively. SWE-bench Pro demonstrates higher resistance to saturation, while BrowseComp has greater impact.
However, BrowseComp also has the lowest resistance to saturation among the top ten. Its adoption by many high-capability models indicates its weight in practical evaluations but does not guarantee that sufficient room for improvement remains within the test.
The leaderboard establishes an order, while the dimensional breakdown explains the differences. When selecting benchmarks, one must consider whether these differences align with the specific evaluation needs of the task at hand.
Is the "Health Check" Reliable?
Can a ranking synthesized from three dimensions effectively reflect the status of evaluation benchmarks? Is this diagnostic stable and reliable when data or computational parameters change?
The research team first attempted removing any single dimension and found that the final rankings were affected in every case: removing resistance to saturation caused an average rank shift of 16.18 positions, with a maximum shift reaching 82 positions. Removing discriminative power or impact also resulted in noticeable changes. Pairwise correlation coefficients among the three dimensions were all below 0.5, further indicating that they provide non-redundant information and offer effective complementary perspectives on benchmark status.
The team then used criteria independent of BHI calculations to categorize benchmarks into two groups: "Known Saturation" and "Active Frontier." The average BHI scores for these groups were 0.227 and 0.600, respectively, consistent with external observations. This further validates BHI’s ability to identify different health states of benchmarks.
Finally, are the results still robust if evaluation records are incomplete?
After randomly removing 30% of the models, the research team found that the Spearman rank correlation coefficient between the old and new rankings remained above 0.97, indicating high consistency in ordering. Rankings also maintained good consistency after introducing score noise, adjusting discrimination thresholds, and modifying short-term prediction parameters.
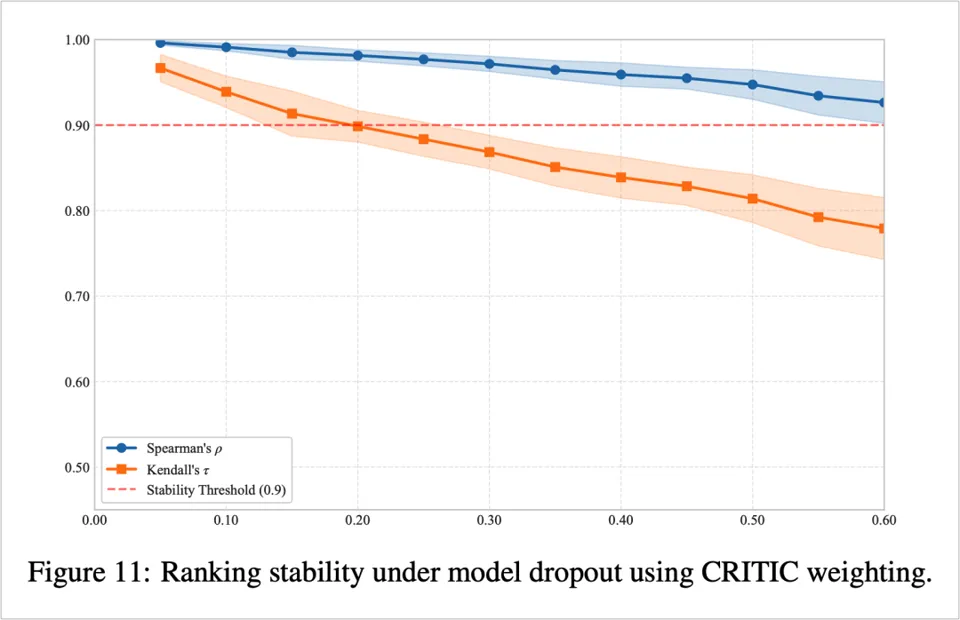
Ranking stability after random removal of some models. The x-axis represents the removal ratio; the blue and orange lines denote the Spearman and Kendall correlation coefficients, respectively. Values closer to 1 indicate greater consistency between the old and new rankings.
Keeping Evaluations Pace with Model Evolution
BHI provides a sustainably updatable reference for assessing the validity of evaluation benchmarks, helping to determine which benchmarks retain discriminative value and which require re-examination.
However, prompts, tool configurations, and testing conditions may vary across different technical reports. Even after score alignment, discrepancies can persist.
It is also difficult to predict precisely when a benchmark will saturate. A breakthrough in training methods or tool capabilities can quickly make originally difficult tasks easy. Short-term trends can signal risks but cannot provide an accurate "expiration date."
Therefore, BHI is best suited as a basis for screening and reviewing evaluation benchmarks, requiring continuous updates as new models and benchmarks emerge.
As models progress, the rulers used to measure them must also undergo regular calibration and evolve toward greater precision.

© THE END
Please contact this official account for authorization before reprinting.
For submissions or media inquiries: [email protected]