Datasette 图表插件 vega 时隔八年更新 0.7 版
原标题:datasette-vega 0.7
38AI 研判分
Datasette 的图表渲染插件 datasette-vega 发布 0.7 版本,这是自 2018 年 7 月以来的首次更新。新版本适配最新 Datasette alpha 版本,并针对 Datasette Lite 做了兼容与外观调整,使该插件可在浏览器端纯前端环境中运行。
报道正文
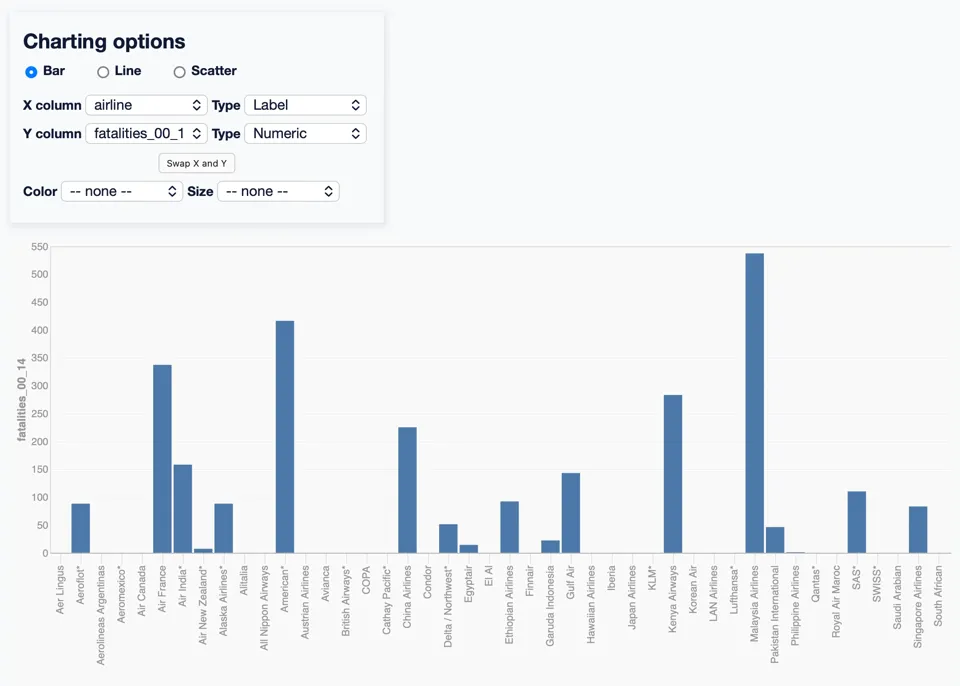
A new release of Datasette's longest untouched plugin, for rendering charts (using Vega-Lite against data in a table or custom query. The last release was in July 2018!
I finally bumped it for compatibility with the latest Datasette alphas, plus some cosmetic tweaks to make it work better with Datasette Lite.
(Datasette Lite just gained the ability to run JavaScript plugins like this! I'll write more about that soon.)
Since it works with Datasette Lite, the live demo in the README now links to this demo on Datasette Lite.