Mozilla 用 2500 万用户实测浏览器指纹可识别性
Mozilla 联合多伦多大学与 UC 圣地亚哥,基于近 2500 万 Firefox 正式版用户开展大规模浏览器指纹可识别性研究,量化了真实用户群体的唯一性程度并定位出导致用户可被识别的关键特征。研究成果直接转化为 Firefox 143 中上线的指纹防护机制,同时公开了论文、完整附录数据、隐私保护聚合数据与分析代码,并提供可交互的自测工具。
报道正文
本文目录8 个章节
1Mozilla Corporation · 2University of Toronto · 3UC San Diego
This is the companion site to a study Mozilla ran on browser fingerprinting. With the help of almost 25 million Firefox release users, we measured how identifiable browsers really are, found which characteristics make them unique, and used that to design the fingerprinting protections that shipped in Firefox 143. Here you can read the paper and its key findings, browse the full appendix data the PDF had no room for, download the privacy-preserving aggregate data and analysis code, learn how the data was collected, and run an interactive test that compares your own browser against the measured population. If you have a question the data could answer, there is also a discussion board for proposing follow-up research.
Browser fingerprinting is a known tracking mechanism on the modern web, but its real-world effectiveness toward users has been hard to measure. To build robust protections, we measured uniqueness across a large, unbiased population, to determined what individual metrics cause users to be unique. These measurements used multiple privacy preserving technologies, like OHTTP, to ensure that no individual users can be identified or tracked across the web. The protections we built into Firefox avoid web compatibility problems while dropping the percentage of uniquely identifiable users from 75% to 46%.
Test your own browser → Read the paper Full appendix data Download the data
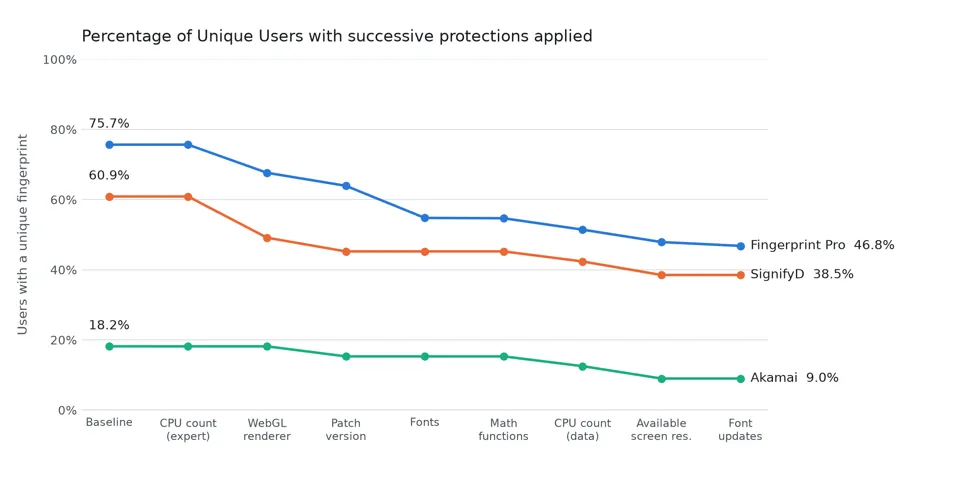
Shows the percentage of users seen as unique by three commercial fingerprinters. Each step adds one protection on top of all the ones before it, weighted across the four operating systems.
Paper abstract
Web browser fingerprinting has become a key tracking mechanism on the modern web, yet its real-world effectiveness and which of the existing mitigations offer value at scale remain insufficiently understood.
In this paper, we present a large-scale study of browser fingerprinting based on real-world telemetry from almost 25 million Firefox release users. This dataset enables us to quantify user uniqueness at population scale and identify which characteristics contribute most to this uniqueness.
Our analysis shows fingerprintability is largely driven by a small set of high-impact characteristics and their combinations, rather than the accumulation of many independent measurements. Building on these insights, we propose and evaluate fingerprinting protections based on their impact on uniqueness and cohort structure, and design data-driven mitigations.
These protections, shipped in Firefox 143, reduce the fraction of uniquely identifiable users from 75% to 46% while maintaining web compatibility, demonstrating that practical reductions in fingerprintability are achievable in a mainstream browser.
Our key findings
Here's what we want to present to you with this paper and the broader scope of our work.
Uniqueness is caused by a small number of metrics - not one or thirty
Fingerprinting test sites have a seemingly endless list of measurements they can pull from your browser. If a user has a unique fingerprint, it is typically not because of a single measurement, but it is also not because of 20 or 30 measurements. It is a small number of metrics that make users unique.
In fact, it's very close to the 80/20 rule. Specifically, of all the users seen as unique by Fingerprint Pro (the most discerning fingerprinter we model) - 80% of them are unique after only 8 metrics - while the fingerprinter collects a total of over 50 metrics. Signifyd collects more metrics, but identifies fewer users as unique: 80% of the users it sees as unique will be identified after 9 metrics despite collecting over 80.
The numbers only mean anything per operating system
Whenever someone cites a single percentage when describing "How many users are unique" - you should be suspicious. Because this collapses multiple different populations that behave very differently.
Firstly, as a baseline, your operating system is always going to be exposed to a fingerprinter. We are always working within the constraint of web compatibility, and lying about the user's operating system breaks shortcut keys and gives you the wrong downloads among other problems. So if we know the website is going to learn your real OS anyway, we can use it to segment the population and analyze it separately.
And when you do you see that each operating system behaves differently because they have different important metrics. Admittedly, it's very difficult to give a concise summary of work and also provide four sets of numbers - so even we fall prey to the trap of providing a single number, as we did in the prior paragraph. But every time we have a single percentage, somewhere we have that number broken down by operating system, and in doing so, you will see that each behaves differently.
Entropy is not the measurement you want
It's so, so easy to take all the results for a metric and just calculate Shannon entropy - it's a standard yardstick in this literature. But as we show - a high Shannon entropy does not reliably predict fingerprinting impact.
Cohort size, not just uniqueness
Previous analyses calculated how many people were unique, but they did not analyze the other people - the ones who weren't. All those other people might be 1 million users who share one fingerprint or 500,000 distinct fingerprints shared by 2 people each - that's quite the difference.
We use the Simpson Index (aka the Herfindahl–Hirschman Index) to quantify that difference and compare different sets of cohorts (shared fingerprints). This lets us compare how effective different fingerprinting defenses are based not just on how much uniqueness they eliminate but how much they collapse groups of users into each other.
For example, two different protections can each lower the share of unique users by about 2.1 percentage points. But one improves the cohort score by 56%, while another raises it by only 13%. Judged on uniqueness alone, two defenses can look equally effective; while the cohort improvement varies significantly.
The same protection performs very differently per platform
Protections are not uniformly impactful, and the variation is not small. As an example, clamping the available screen resolution takes 25.3 percentage points off cumulative macOS uniqueness but between 0 and 3 points off the other three platforms. Averaged across all users, that 25-point drop shrinks to 3.5 - a protection that matters enormously to one platform can look marginal in the aggregate.
This is yet another reason why it's so important to segment and analyze data on a per-operating-system basis.
Standardization and randomization go hand-in-hand
Making users report the same values makes them look more alike, but it never makes everyone look the same. Some users will still stand out, and that gets worse on websites with small visitor populations. Standardization improves the situation, but it should still be paired with randomization. Randomization is very strong when it works, but can always be detected and bypassed. Neither can carry the burden of providing privacy on its own.
The data shows why values differ, not just that they do
Correlating fingerprinting values with users' hardware and other characteristics let us identify why certain measurements differed between users. Knowing the root cause lets us build protections that reach much further, and protect small groups of users who would otherwise stand out as a minority.
Addressing these differences has already produced more consistent outputs for image rendering, Web Audio, and mathematical operations on Android, with more root causes being investigated.
Users don't connect website breakage to the setting
Breakage from a strict mode is delayed, and the delay hides the cause. Turning on a stricter mode is a one-time act - but the broken website arrives later and nothing connects the two. From the user's perspective, this website doesn't work in Firefox and they have no idea why and are frustrated. Report after report we see people posting for help, confused - despite having taken specific action to enable a hidden setting opting them into strict fingerprinting protections.
Protections that ship have to keep the web working
Users don't realize that a setting they changed caused the breakage, and don't know how to fix it - so a protection that breaks the web breaks the browser along with it. We selected and tuned mitigations on both measured impact and compatibility. For a default, compatibility isn't a trade-off against privacy - it's a precondition for it.
The hard part is finding what breaks
The web is vast, and even the most innocuous change is likely to break something somewhere. Some breakage can be anticipated, which helps design, testing, and detection. The other breakage gets fixed only if a chain of luck holds: someone has to recognize the breakage, report it, reproduce it on the right hardware, and get it to the right person.
We are deliberately not publishing everything we could
Commercial fingerprinters evolve continuously, and they borrow openly from the community that studies them. Sites built to teach people about fingerprinting - CreepJS among them - get picked up and used outright by fingerprinting products.
So we have been deliberately conservative. There are analyses this dataset would support that we have not run, data we could have released that we have not, and offensive angles on this work that we have not pursued. That is a choice rather than an oversight: we would rather leave a question open than make it easier to build a better fingerprinter.
Test your own browser
This interactive test re-implements individual measurements as close as possible to how Firefox's own collection code performed them, runs in your browser, and compares each result against the published aggregate data. For every characteristic you can see your value and how many of the ~25 million measured browsers share it - overall and within your operating system.
The test runs entirely in your browser. All comparisons happen locally, against our static reference files. No data is stored or submitted to us.
If the test, or anything else on this site, looks wrong, please report it as an issue on GitHub. For a problem with the test, include the diagnostics from its Copy diagnostics button, or, if you would rather not post your measured values publicly, email them to [email protected].
Paper
The extended version of the paper is available as a PDF.
Read the extended version (PDF) →
Full appendix data
The paper's appendices contain a wealth of data locked behind a reasonable page limit and PDF formatting. This full data page carries all of it - every rank for every operating system and all three modeled services, the complete protection chains, and the paper's figures regenerated at print resolution.
Data collection
Our measurements come from Firefox telemetry, specifically the user-characteristics ping, a dedicated telemetry ping. Unlike normal telemetry pings that are sent regularly, this ping must be explicitly enabled (which has happened twice, once in 2025 and once in 2026), and sends one data report before becoming dormant again.
This ping carries no client ID, only a UUID unique to the ping used to de-duplicate users. It cannot be keyed to any other telemetry submissions. It is submitted over Oblivious HTTP (OHTTP): a relay operated independently of Mozilla forwards the encrypted submission, so the relay can see the sender's IP address but not the contents, and Mozilla receives the contents but not the IP address. Access to the collected data was restricted to four authorized Mozilla employees. The data was retained for 90 days and has since been deleted.
Read about the data collection →
Aggregate data & analysis code
We release four types of data:
- A list of fingerprints generated for different phases of protections, per modeled fingerprinter, with the user's OS and locale unmasked.
- Aggregate tables of the frequency of value per metric, split by OS
- Aggregate tables of the frequency of value per metric, correlated by other metrics' values, again split by OS
- A detailed analysis of rendered canvas images that allows comparison
In the fingerprint lists, the fingerprints cannot be recreated from a website measuring user characteristics, due to the way the telemetry was collected. After being generated, the files were shuffled to a new ordering, and any locale occurring fewer than 100 times was anonymized.
In the aggregate tables, any value observed fewer than 100 times within a single per-OS population is withheld - so the published data describes cohorts, never individuals.
In the canvas comparison, raw canvas renderings are provided, but they are devoid of any connection to other user data. Any unique canvas rendering is not provided; only the hash.
For verification and exploration, the code used to process the data and perform different analyses is available for review. It additionally contains the specific fingerprinting scripts captured, reverse engineered, and modeled for the paper.
Download the data → Canvas explorer → Analysis code →
Future Research
Far more can be asked of this dataset than we have asked. Some of it we chose not to pursue, some of it we simply did not think of, and some of it is a better fit for someone who is not us.
There is a discussion board for proposing follow-up analyses. Two kinds are worth posting:
- Answerable from the published aggregate data. Anyone can run these - the per-operating-system distributions are released, and the analysis toolkit is open. Post the question anyway, so the work is not duplicated and so the result lands somewhere others can find it.
- Needs the raw data. These we would have to run ourselves, since the underlying ping data is not something we can ever release. Describe what you want to know and why! To be clear, we do not have the raw data anymore but it is possible we will perform a re-collection in the future which we could analyze. We cannot promise to run everything, and some questions we will decline because we do not wish to help build a better fingerprinter.